

There’s No Place Like Home, Part 3
There’s no place like HOME. (Part 3, Weds Apr 8, 2020)
[Posted at 9:30 am, Weds April 8, 2020]
This is Part 3 of our regular real estate market update series during the COVID-19 stay at home directives (see Part 2 here).
Dear neighbors,
Our team is getting into a NEW groove while we focus our work from home offices (and kitchen tables and patios!), as we keep our clients at the forefront of our thoughts and efforts. As ever during this pandemic, please stay home and stay safe. If you find yourself with the time and have questions or want to chat about real estate, PLEASE give us a call!
A reminder that you can find COVID-19 updates from DC Government here.
We continue to closely monitor the market and provide data-driven updates about what is happening in the Washington DC real estate market. We also dive even deeper into the 20002 and 20003 hyper-local market every week.
Washington D.C. Real Estate Market Numbers
This week, we look at a 12-month flow within Washington D.C. [See Graph 1] including data on:
- New listings
- Median price
- EOM, available inventory at end of each month
- MSI, months supply of inventory
Graph 1.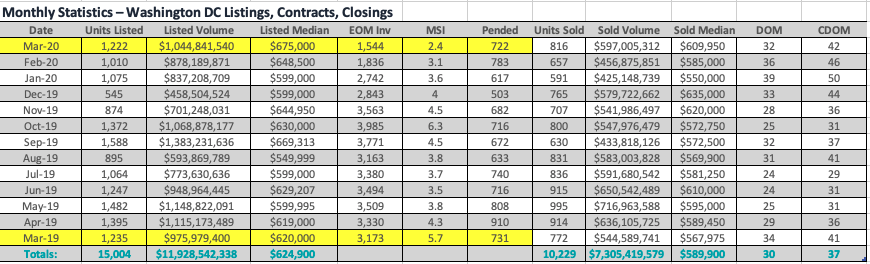
Conclusion March 2020, across Washington D.C.:
March 2020 started out in a typical real estate setting, but 50% of March was affected by rules related to COVID-19. Despite these limitations in the latter part of March, the March 2020 market looks very similar to the March 2019 market. However, due in part to the ‘hot’ January and February markets in 2020, we see lower month-end available inventory for March 2020.
Capitol Hill and Surrounding Neighborhoods [See Graph 2]
What’s happening on Capitol Hill and surrounding neighborhoods? This week we also looked back on the past 28 days of activity in 20002 and 20003, within a 1-mile radius of Lincoln Park.
Graph 2.
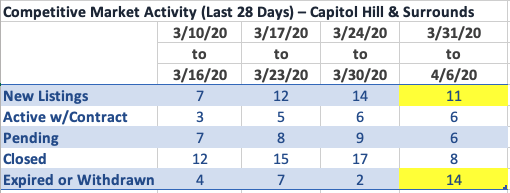
The number of new listings and contracts achieved looks remarkably steady from week to week.
We call your attention to two numbers:
- New Listings (first row). A slight dip in new listings from 3/31 through 4/6. In a perfect spring market, new listings tend to climb by up to 20% as we progress through March and April. Last week, our hyper-local market saw a 20% dip in new listings. Trend or fluke? We will keep an eye on this for you.
- Expired or Withdrawn (bottom row). We saw a dramatic jump in expired or withdrawn listings in the last week. Listing agreements typically expire at the end of a month, so while it isn’t unusual to see listings expire, we generally don’t see 5 times as many as we enter a new month.
The contract numbers show us that Realtors and their clients are still finding safe ways to visit property, make decisions, and negotiate contracts. (If you are curious, you can check out 3D tours for our listings here). We believe that the numbers we highlight in Graph 2 reflect a pause by some sellers as they consider their options in a changing market for various reasons, ranging from the practicality of showing their home if it is occupied, to a possible change in economic outlook.
We are having daily conversations with our seller clients and neighbors to help deliberate these very challenges. While it is impossible to know how much of that inventory will return in the near future, for now, expired and withdrawn listings further constrict inventory in a historically tight zone. These numbers maintain underlying value calculations.
We will continue to closely monitor the weekly activity for consultation to all of our buyer and seller clients – and you can read about general trends right here on our website.
As always, don’t hesitate to reach out to any agent on our team for consultation on your particular real estate investments and goals, and our most up-to-date recommendations.
Stay safe and well,
Joel

Joel Nelson Group, KW Capital Properties
202-243-7707