
FEBRUARY Real Estate Market Capitol Hill
FEBRUARY 2021 Neighborhood Numbers are IN for the Capitol Hill Real Estate Market!
Mortgage rates ticked slightly up, but continue to hover around 3% — in Feb 2021 we averaged 3.17% compared to 3.50% in Feb 2020. This slight upward movement in 2021 (predicted by experts) has not yet dampened buyer demand, which remains strong especially in and around the District. We are seeing some overbidding for select homes in select areas, but our Buyer Agents continue to pound the pavement to help their buyers find success in the market.
In Washington DC…
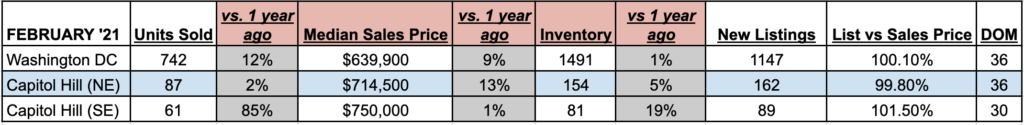
- Sellers achieved 100.1% of list price (continuing to hover ~ 100% for recent months).
- The median price for a home sold in February was $639,900, up 9% year-over-year (and up from $600k in Jan)
- Capitol Hill NE had the most new listings by neighborhood in the District, followed by Adams Morgan, and Penn Quarter / Shaw.
Compare our Capitol Hill neighborhood with the rest of DC below:
A few highlights:
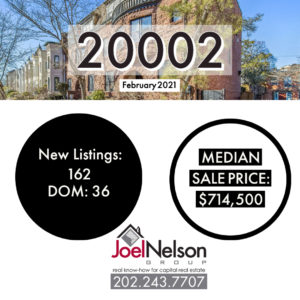
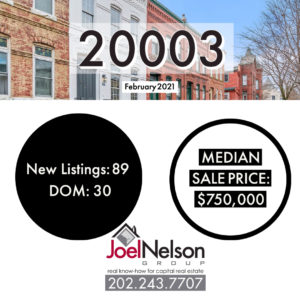
- Median sales prices in each Capitol Hill zip code continues to stay above the DC median of $639,900, with 20003 remaining consistent from 1 year ago, and 20002 seeing a 13% rise in median sale price from one year ago.
- In 20002 neighborhood (NE CapHill), we see more consistency from January to February 2021, with the exception of the increase in median price.
- In 20003 neighborhood (SE CapHill), DOM was down from 41 to 30, and median price and % of list price were up, all indicating a competitive market for homes in 20003 in 2021 so far. There are also notable increases in the year-over-year units sold (+ 85%), and inventory (+19%).
We continue to SAFELY and SMARTLY prepare homes for the market with our FULL SERVICE offerings, and to assist our SELLERS find their next or FIRST home! Here’s a look at WHAT SOLD THIS WINTER.
TALK TO US NOW about your 2021 real estate goals!
202.243.7707